Datasets - JMeter
The Maisqual JMeter data set was published by SQuORING Technologies under an open source licence during the Maisqual research project. It features a number of metrics extracted from code, configuration management and communication channels, plus a bunch of findings from popular rule-checking tools.
About the JMeter project
The Apache JMeter desktop application is an open source, 100% pure Java application designed to load test functional behavior and measure performance of Java client/server applications. It is widely used both in the industry and in open-source projects and is an essential part of the classical tool suite for Java development. Development of JMeter was initially started by Stefano Mazzocchi of the Apache Software Foundation, primarily to test the performance of Apache JServ (a project that has since been replaced by the Apache Tomcat project). JMeter steadily grew to enhance the GUI and to add functional-testing capabilities, and became a subproject of Apache Jakarta in 2001, with dedicated mailing lists and development resources. JMeter became eventually a top level Apache project in November 2011, with its own Project Management Commitee and a dedicated website.
JMeter weekly
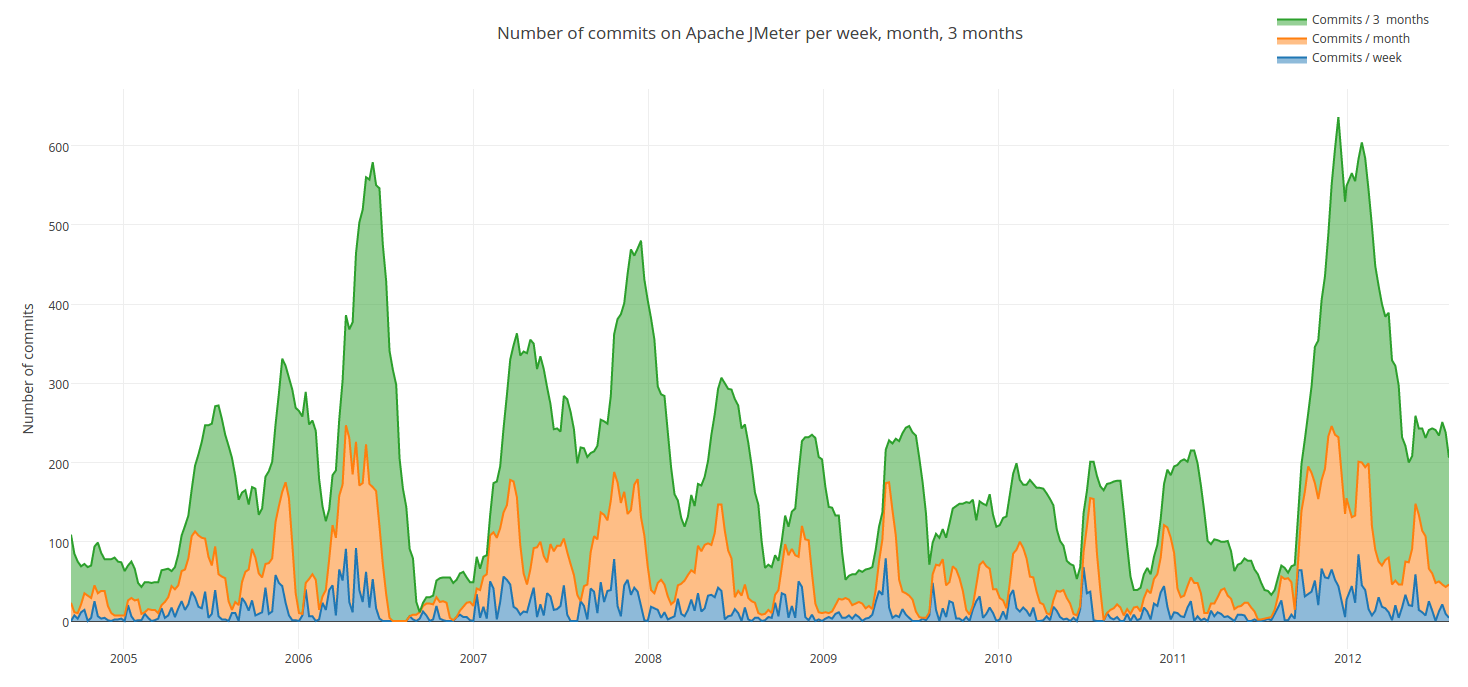
The weekly evolution data set starts on the 2004-09-13 and ends on the 2012-07-30, which constitutes 411 versions across 9 years. You can check the detailed definition of metrics on the metrics page.
Downloads:
- Full compressed archive: metrics_jmeter_evo_v3.1.tar.xz.
- Application-level metrics: metrics_jmeter_evo_app_v3.1.csv.xz.
- Files-level metrics: metrics_jmeter_evo_file_v3.1.csv.xz.
- Functions-level metrics: metrics_jmeter_evo_func_v3.1.csv.xz
JMeter releases
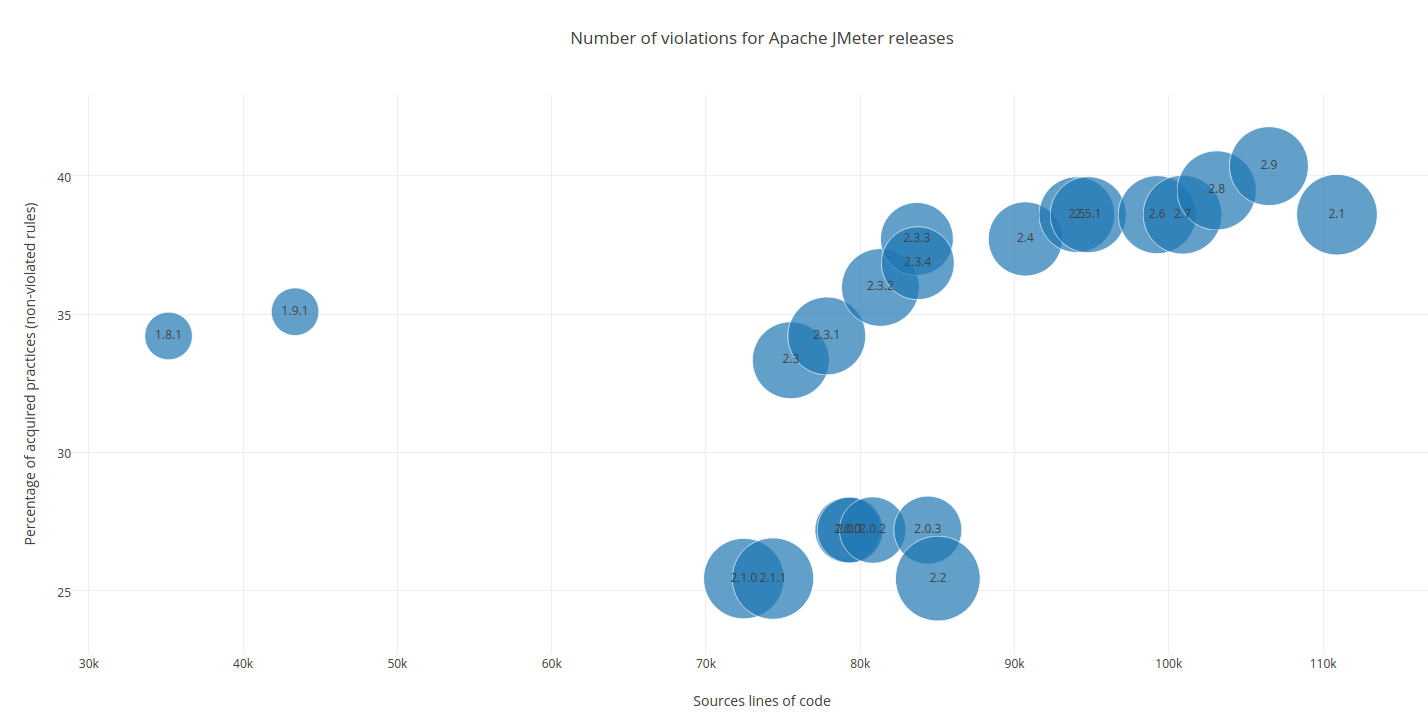
The Maisqual JMeter data set features analysis of the 18 official releases of the Apache JMeter project published at the time of writing. Metrics proposed are the same as for the weekly data set, excepted for some time-based metrics which make no sense in an irregularly time-paced list (e.g. number of mails exchanged during last month).
Downloads:
- Full compressed archive: metrics_jmeter_release_v3.1.tar.xz.
- Application-level metrics: metrics_jmeter_release_app_v3.1.csv.gz.
- Files-level metrics: metrics_jmeter_release_file_v3.1.csv.gz.
- Functions-level metrics: metrics_jmeter_release_func_v3.1.csv.gz
The list of included releases is provided below with their publication date:
| Version | Date | Version | Date |
|---|---|---|---|
| 1.8.1 | 2003-02-14 | 2.3.2 | 2008-06-10 |
| 1.9.1 | 2003-08-07 | 2.3.3 | 2009-05-24 |
| 2.0.0 | 2004-04-04 | 2.3.4 | 2009-06-21 |
| 2.0.1 | 2004-05-20 | 2.4 | 2010-07-14 |
| 2.0.2 | 2004-11-07 | 2.5 | 2011-08-17 |
| 2.0.3 | 2005-03-22 | 2.5.1 | 2011-10-03 |
| 2.1.0 | 2005-08-19 | 2.6 | 2012-02-01 |
| 2.1.1 | 2005-10-02 | 2.7 | 2012-05-27 |
| 2.2 | 2006-06-13 | 2.8 | 2012-10-06 |
Using the data sets
You can import them easily into LibreOffice by simply double-clicking on the file and selecting '!' (exclamation mark) as the separator. Don't use anything else as separator, since fields may contain other characters, e.g. commas. The following image shows a plot made with LibreOffice:
In the following R code example, we look at the density of some common metrics across files of JMeter 2012-07-30.
> project_data <- read.csv("metrics_jmeter_evo_file_v3.1.csv", sep="!")
> project_data_20120730 <- project_data[project_data[,c("Version")] == "2012-07-23",]
> jpeg(file="jmeter_20120730_density_commits.jpg",
      width=1200, height=1200, quality=100,
      pointsize=12, res=100)
> plot(density(project_data_20120730[, c("SCM_COMMITS_TOTAL")]),
      main="Density of commits on files for JMeter 2012-07-30")
> dev.off()

