Datasets - Ant
The Maisqual Ant data set was published by SQuORING Technologies under an open source licence during the Maisqual research project. It features a number of metrics extracted from code, configuration management and communication channels, plus a bunch of findings from popular rule-checking tools.
About the Ant project
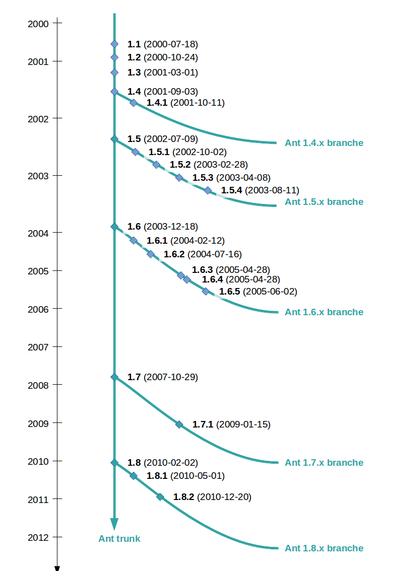
The early history of Ant begins in the late nineties with the donation of the Tomcat software from Sun to Apache. From a specific build tool, it evolved steadily through Tomcat contributions to be more generic and usable. James Duncan Davidson announced the creation of the Ant project on the 13 January 2000, with its own mailing lists, source repository and issue tracking. There have been many versions since then: 8 major releases and 15 updates (minor releases). The data set ends in July 2012, and the last version officially released at the time of creating this data set (2012) is 1.8.4. It should be noted that the data set of official releases may show inconsistencies with the weekly data set, since the build process extracts and transforms a subset of the actual repository content.
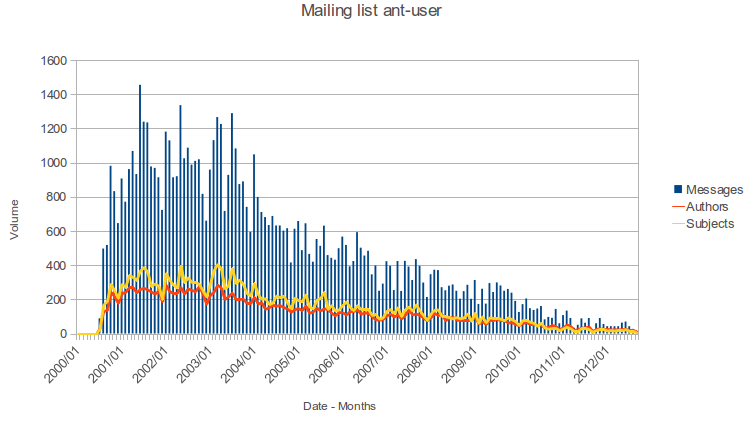
Ant is arguably one of the most relevant examples of a successful open source project: from 2000 to 2003, the project attracted more than 30 developers whose efforts contributed to nominations for awards and to its recognition as a reliable, extendable and well-supported build standard for both the industry and the open source community. An interesting aspect of the Ant project is the amount of information available on the lifespan of a project — check the plot displayed below: from its early beginnings in 2000, activity had its climax around 2002-2003 and then decreased steadily. Although the project is actively maintained and still brings regular releases the list of new features is decreasing with the years. It is still hosted by the Apache Software Foundation, which is known to have a high interest in software product and process quality.

Maisqual Ant weekly
The Maisqual Ant data set features 636 versions of the Apache Ant project, extracted on every monday since the beginning of the project. You can check the detailed definition of metrics on the metrics page.
The weekly data set can be downloaded from bellow:
- Full compressed archive: metrics_ant_evo_v3.1.tar.xz.
- Application-level metrics: metrics_ant_evo_app_v3.1.csv.xz.
- Files-level metrics: metrics_ant_evo_file_v3.1.csv.xz.
- Functions-level metrics: metrics_ant_evo_func_v3.1.csv.xz
Maisqual Ant releases
The Maisqual Ant data set features analysis of the 22 official releases of the Apache Ant project published at the time of writing. Metrics proposed are the same as for the weekly data set, excepted for some time-based metrics which make no sense in an irregularly time-paced list (e.g. number of mails exchanged during last month).
The releases data set can be downloaded from below:
- Full compressed archive: metrics_ant_release_v3.1.tar.xz.
- Application-level metrics: metrics_ant_release_app_v3.1.csv.xz.
- Files-level metrics: metrics_ant_release_file_v3.1.csv.xz.
- Functions-level metrics: metrics_ant_release_func_v3.1.csv.xz
Included releases, along with their date of publication, are provided in the table below:
| Version | Date | Version | Date | |
|---|---|---|---|---|
| 1.1 | 2000-07-18 | 1.6.2 | 2004-07-16 | |
| 1.2 | 2000-10-24 | 1.6.3 | 2005-04-28 | |
| 1.3 | 2001-03-02 | 1.6.4 | 2005-05-19 | |
| 1.4 | 2001-09-03 | 1.6.5 | 2005-06-02 | |
| 1.5.0 | 2002-07-15 | 1.7.0 | 2006-12-19 | |
| 1.5.1 | 2002-10-03 | 1.7.1 | 2008-06-27 | |
| 1.5.2 | 2003-03-03 | 1.8.0 | 2010-02-08 | |
| 1.5.3 | 2003-04-09 | 1.8.1 | 2010-05-07 | |
| 1.5.4 | 2003-08-12 | 1.8.2 | 2010-12-27 | |
| 1.6.0 | 2003-12-18 | 1.8.3 | 2012-02-29 | |
| 1.6.1 | 2004-02-12 | 1.8.4 | 2012-05-23 |
Using the data sets
You can import them easily into LibreOffice by simply double-clicking on the file and selecting '!' (exclamation mark) as the separator. Don't use anything else as separator, since fields may contain other characters, e.g. commas. The following image shows a plot made with LibreOffice:

A (by far) more powerful software for data mining is R. The data set can be imported in R with the following commands:
project_app  <- read.csv('metrics_app_Ant_e.csv', sep='!')
names(project_app)
  [1] "Application"                        "Version"
  [3] "BLAN"                               "BRAC"
  [5] "CFT"                                "CLAS"
  [7] "CLOC"                               "COM_DEV_AUTH_1M"
  [9] "COM_DEV_AUTH_3M"                    "COM_DEV_AUTH_1W"
 [11] "COM_DEV_RESP_TIME_MED_1M"           "COM_DEV_RESP_TIME_MED_3M"
 [13] "COM_DEV_RESP_TIME_MED_1W"           "COM_DEV_RESP_VOL_1M"
 [15] "COM_DEV_RESP_VOL_3M"                "COM_DEV_RESP_VOL_1W"
 [17] "COM_DEV_VOL_1M"                     "COM_DEV_VOL_3M"
 [19] "COM_DEV_VOL_1W"                     "COM_DEV_SUBJ_1M"
 [21] "COM_DEV_SUBJ_3M"                    "COM_DEV_SUBJ_1W"
 [23] "COM_USR_AUTH_1M"                    "COM_USR_AUTH_3M"
 [25] "COM_USR_AUTH_1W"                    "COM_USR_RESP_TIME_MED_1M"
 [27] "COM_USR_RESP_TIME_MED_3M"           "COM_USR_RESP_TIME_MED_1W"
 [29] "COM_USR_RESP_VOL_1M"                "COM_USR_RESP_VOL_3M"
 [31] "COM_USR_RESP_VOL_1W"                "COM_USR_SUBJ_1M"
 [33] "COM_USR_SUBJ_3M"                    "COM_USR_SUBJ_1W"
 [35] "COM_USR_VOL_1M"                     "COM_USR_VOL_3M"
 [37] "COM_USR_VOL_1W"                     "COMR"
 [39] "DITM"                               "ELOC"
 [41] "FILE"                               "FUNC"
 [43] "LADD"                               "LC"
 [45] "LMOD"                               "LREM"
 [47] "MLOC"                               "NCC"
 [SNIP...]
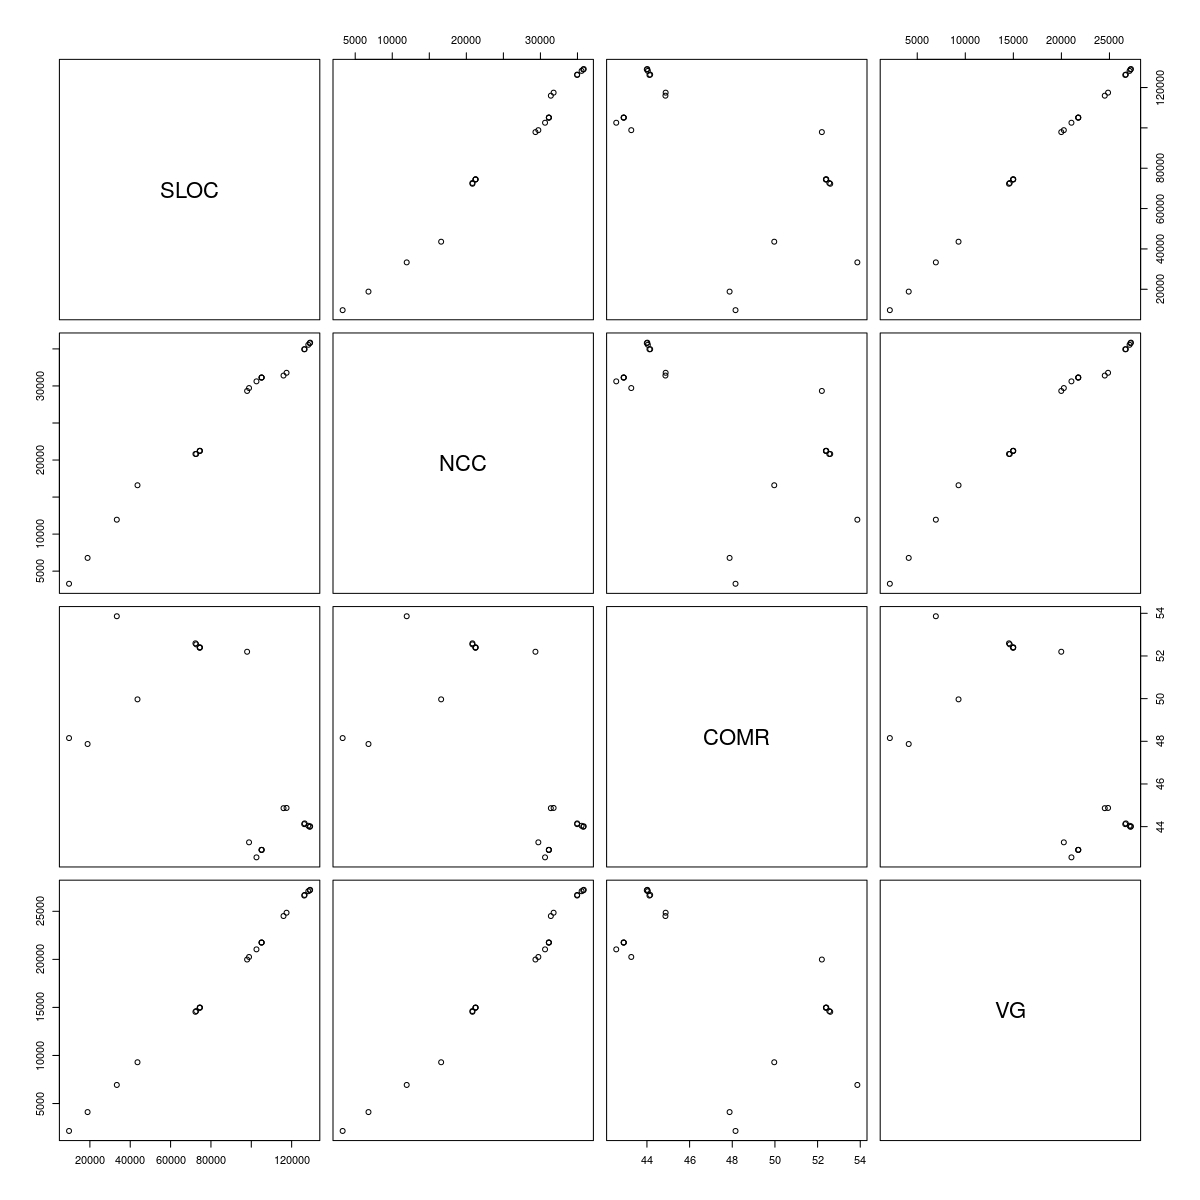
From there you have all data at hand. You can easily plot it:
jpeg(file="file_scatter_lines.jpg",
     width=1200, height=1200, quality=100,
     pointsize=12, res=100)
plot(project_app[,c("SLOC", "NCC", "COMR", "VG")])
dev.off()

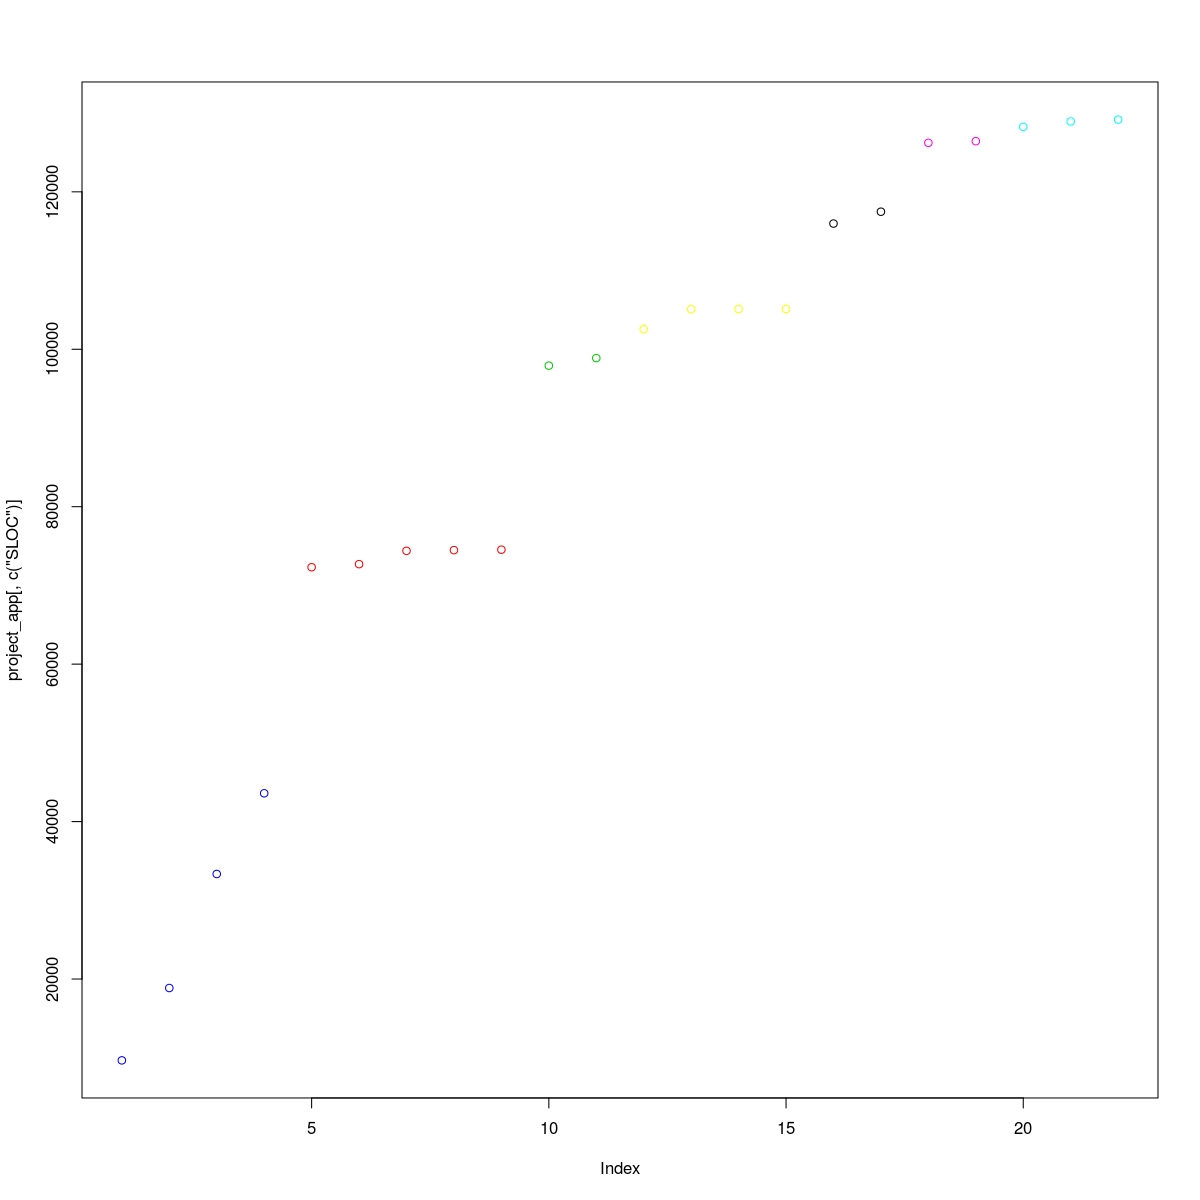
You can apply your own data mining techniques to the set as well. As an example in the following extract we want to find categories of files depending on their size (i.e. source lines of code). For that purpose we apply k-means clustering to the SLOC metric at the file level and display the results, showing different colours for the output clusters.
project_app_kmeans_sloc_7 <- kmeans(project_app$SLOC, 7)
groups_sloc_7 <- table(project_app_kmeans_sloc_7$cluster)
jpeg(file="file_kmeans_sloc_7.jpg",
       width=1200, height=1200, quality=100,
       pointsize=12, res=100)
plot(project_app[,c("SLOC")],
       col=project_app_kmeans_sloc_7$cluster)
dev.off()
