PolarSys
Published: 11 Nov 2013
PolarSys is an Eclipse Industry Working Group created by large industry players and by tool providers to collaborate on the creation and support of Open Source tools for the development of embedded systems. Members of PolarSys started working on a Maturity Assessment task force back in 2013, to provide an evaluation of the quality of software components entering the PolarSys umbrella, and to provide advice and guidance to improve it.
Castalia Solutions has been selected to define and implement the Maturity Assessment process, and to work with the projects to continuously improve it. Our partner Bitergia provides an important part of the metrics retrieval process, using MetricsGrimoire.
Resources
- PolarSys web site polarsys.org
- PolarSys wiki polarsys.org/wiki
The Quality Model
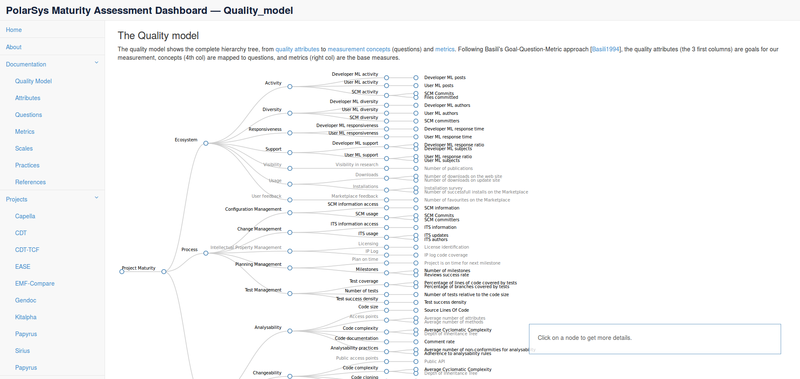
The PolarSys quality model has been discussed and defined through consensus among the PolarSys members. Its final version can be seen on the PolarSys dashboard: dashboard.polarsys.org/documentation/quality_model.html. This specific visualisation uses D3js to represent the tree structure of the model and provides detailed information on each node.
The PolarSys dashboard
Castalia Camp used to host an early version of the dashboard, available at dashboard.castalia.camp. It is now obsolete and has been moved to the Eclipse infrastructure. Please update your bookmarks!
The live version of the PolarSys dashboard is available at dashboard.polarsys.org.
Visualising the PolarSys quality model
The quality model setup for the PolarSys maturity assessment project was defined in a json file, and it was decided to use D3js to provide a nice and efficient visualisation of its structure. This page describes how to setup a workspace to develop and use the D3js visualisation files of the PolarSys/Eclipse quality model.
Note: The early versions of the quality models were put in GitHub. Things have been moved in BitBucket since then and have considerably evolved, but the structure is roughly the same.
Pre-requisistes
You'll need to run a local web server from the working directory to execute the javascript smoothly. There are several ways to do this; first option is to use the Node.js facilities offered by npm. To install a lightweight http server, type in as root (if you want the program to be installed for all your users, otherwise it can simply be installed as a user):
npm install http-server -g
Then simply go to the directory you want to be served and type in:
http-server .
Another option is to use Python's SimpleHTTPServer. Just go to the directory you want to serve, and type in:
python -m SimpleHTTPServer 8080
Whatever the method used you can check it works fine by opening a browser at the url localhost:8080. It should display the contents of the directory, since there is no index.
Get the sources
First clone the git repository from github:
git clone https://github.com/borisbaldassari/PolarsysMaturity.git
In this example the repository is cloned in the ~/git/ directory, and the sources are thus available in ~/git/PolarsysMaturity. After cloning, the structure should look like the following:
data/contains json files describing the quality model at various levels (simple, medium, full), the measurement concepts and metrics used. For an overview of the quality model structure check the PolarSys wiki.qm_visualisation/contains html files for the visualisation of the json quality model. An example for the full quality model is available there: http://borisbaldassari.github.io/PolarsysMaturity/qm/polarsys_qm_full.html .scripts/contains some scripts to check the structure of the json files, export it to various human-readable formats (html, mediawiki formatting), and publish the maturity assessment results.
Navigate to the visualisation page
Open a terminal, go to the parent directory of PolarsysMaturity and serve this directory:
cd ~/git/ && http-server .
Now open a browser and go to localhost:8080/PolarsysMaturity/qm_visualisation/. You should see something like this:

Click on the html page you want to display; for the full hierarchy of the quality model go for polarsys_qm_full.html
Do some changes and debug
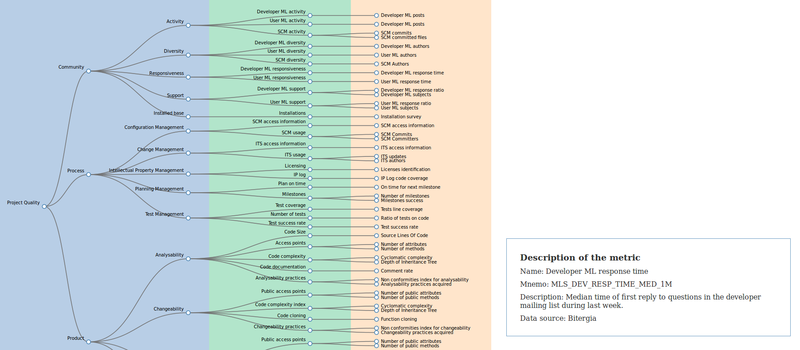
Open one of the html files and do some changes to the javascript, then go back to the browser and refresh the page, changes should be visible immediately. The main visualisation used for the PolarSys maturity assessment project gets the needed information from a set of different files, all located in the data directory. Namely there are:
- polarsys_qm_full.json holds the structure of the model itself, plus the definition and additional information of all quality attributes (first column).
- polarsys_concepts.json holds all the information displayed in the bottom-right box about concepts (second column).
- polarsys_metrics.json holds all the information displayed in the bottom-right box about metrics (third column).
Each browser has its own debugging tools. For firefox, simply open the Web Development Tools panel and watch the javascript console. Any warning or error should pop up here, along with the link downloaded during execution and so on.